3. Introduction to NetworkX#
We will use the Python library NetworkX. It is well documented and several examples are available.
It is not the only Python library available for network analysis. Another very good one is graph-tool. Also the SNAP library provides an excellent tool to analyze very large networks.
3.1. NetworkX preliminaries#
import networkx as nx

from operator import itemgetter

import math
We import the plotting library seaborn which integrates very well with matplotlib. More documentation is available here: https://seaborn.pydata.org/
import seaborn as sns
%pylab inline
Populating the interactive namespace from numpy and matplotlib
import watermark

%load_ext watermark
%watermark -n -v -m -iv
watermark        2.0.2
re               2.2.1
numpy            1.20.3
matplotlib       3.1.3
seaborn          0.11.2
matplotlib.pylab 1.20.3
networkx         2.3
logging          0.5.1.2
Fri Apr 01 2022

CPython 3.7.1
IPython 5.8.0

compiler   : Clang 4.0.1 (tags/RELEASE_401/final)
system     : Darwin
release    : 19.6.0
machine    : x86_64
processor  : i386
CPU cores  : 8
interpreter: 64bit
Generate an empty UNDIRECTED graph with NetworkX
G = nx.Graph()
Add nodes from a list of names
G.add_nodes_from(["Luca", "Andrea", "Sara", "Carlo", "Veronica"])
G.nodes()
NodeView(('Luca', 'Andrea', 'Sara', 'Carlo', 'Veronica'))
Add another node
G.add_node("Giovanni")

print("The nodes of G are: ", G.nodes())
The nodes of G are: ['Luca', 'Andrea', 'Sara', 'Carlo', 'Veronica', 'Giovanni']
So far we have nodes in the networks but no edges. Let’s add edges from a list of tuples.
G.add_edges_from(
    [
        ("Luca", "Sara"),
        ("Andrea", "Luca"),
        ("Carlo", "Veronica"),
        ("Sara", "Veronica"),
        ("Giovanni", "Andrea"),
    ]
)
We add another edge and ‘Lucia’ is a new node.
G.add_edge("Veronica", "Lucia")

print("The nodes of G are : ", G.nodes())
print("---")
print("The links of G are : ", G.edges())
The nodes of G are :  ['Luca', 'Andrea', 'Sara', 'Carlo', 'Veronica', 'Giovanni', 'Lucia']
---
The links of G are :  [('Luca', 'Sara'), ('Luca', 'Andrea'), ('Andrea', 'Giovanni'), ('Sara', 'Veronica'), ('Carlo', 'Veronica'), ('Veronica', 'Lucia')]
We want to add the property ‘age’ to each node. By default, each node is assigned to an empty dictionary to store metadata.
G.nodes["Lucia"]
{}
for n in G.nodes():
    if n[0] == "L":
        G.nodes[n]["age"] = 24
    else:
        G.nodes[n]["age"] = 28

# show the nodes with their age
print(G.nodes(data=True))
[('Luca', {'age': 24}), ('Andrea', {'age': 28}), ('Sara', {'age': 28}), ('Carlo', {'age': 28}), ('Veronica', {'age': 28}), ('Giovanni', {'age': 28}), ('Lucia', {'age': 24})]
How to remove a node?
G.remove_node("Luca")
print(G.nodes(data=True))
print("---")
print(G.edges())
[('Andrea', {'age': 28}), ('Sara', {'age': 28}), ('Carlo', {'age': 28}), ('Veronica', {'age': 28}), ('Giovanni', {'age': 28}), ('Lucia', {'age': 24})]
---
[('Andrea', 'Giovanni'), ('Sara', 'Veronica'), ('Carlo', 'Veronica'), ('Veronica', 'Lucia')]
If we remove an edge, we do not remove the nodes!
G.remove_edge("Giovanni", "Andrea")
print(G.nodes())
['Andrea', 'Sara', 'Carlo', 'Veronica', 'Giovanni', 'Lucia']
Degree is easily accessible
G.degree("Veronica")
3
G.degree()
DegreeView({'Andrea': 0, 'Sara': 1, 'Carlo': 1, 'Veronica': 3, 'Giovanni': 0, 'Lucia': 1})
for i in G.degree():
    print(i[0], G.degree()[i[0]])
Andrea 0
Sara 1
Carlo 1
Veronica 3
Giovanni 0
Lucia 1
3.1.1. Analyze the citHepTh network with NetworkX#
We analyze the citation dataset (citHepTh) available on the Stanford Large Network Data Colletion.
Keep in mind that the network is directed!
filepath = "./../datasets/cit-HepTh.txt"
H = nx.DiGraph()
fh = open(filepath, "r")

# reading all the file lines
for line in fh.readlines():
    # remove "\n" characters (.strip()) and split the line at blank spaces (split.())
    s = line.strip().split()
    if s[0] != "#":
        # the first lines are comments
        origin = int(s[0])
        dest = int(s[1])

        H.add_edge(origin, dest)

# chiudo il file
fh.close()
print("The network has", len(H), "nodes")
The network has 27770 nodes
print("The network has", len(H.edges()), "edges")
The network has 352807 edges
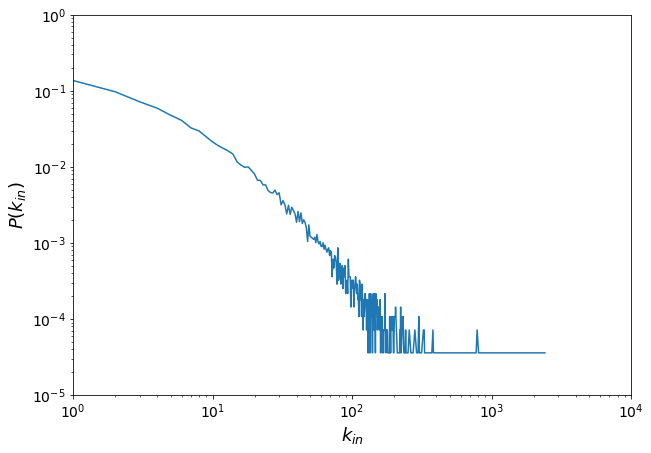
3.1.1.1. We want to count how many nodes have a given degree-in#
The Counter module is a dictionary subclass that allows quick item counting.
indeg = dict(H.in_degree()).values()
from collections import Counter

degin_distri = Counter(indeg)
print(degin_distri)
Counter({0: 4590, 1: 3787, 2: 2700, 3: 1992, 4: 1643, 5: 1327, 6: 1134, 7: 903, 8: 823, 9: 692, 10: 591, 11: 527, 12: 484, 13: 447, 14: 409, 15: 322, 16: 293, 18: 278, 17: 274, 19: 249, 20: 223, 22: 185, 21: 185, 24: 161, 23: 161, 28: 137, 25: 136, 26: 128, 30: 127, 27: 126, 29: 120, 32: 100, 33: 88, 31: 88, 35: 87, 37: 82, 38: 74, 41: 72, 43: 69, 39: 67, 34: 67, 36: 66, 45: 56, 42: 53, 40: 52, 46: 52, 44: 50, 49: 48, 47: 44, 56: 36, 50: 34, 54: 33, 51: 33, 52: 32, 53: 31, 59: 29, 57: 29, 48: 29, 55: 28, 62: 28, 58: 27, 64: 26, 60: 25, 61: 25, 68: 24, 79: 24, 63: 23, 65: 23, 67: 23, 70: 22, 71: 21, 66: 21, 69: 19, 75: 19, 76: 18, 73: 17, 94: 17, 77: 15, 82: 15, 89: 14, 85: 14, 87: 13, 74: 13, 81: 12, 84: 11, 95: 10, 88: 10, 96: 10, 72: 10, 97: 10, 106: 10, 92: 9, 80: 9, 102: 9, 101: 9, 113: 9, 99: 9, 118: 8, 114: 8, 107: 8, 105: 8, 78: 8, 83: 8, 109: 8, 91: 7, 86: 7, 100: 7, 90: 6, 148: 6, 104: 6, 124: 6, 142: 6, 144: 6, 136: 6, 133: 6, 172: 6, 116: 6, 108: 6, 93: 6, 115: 5, 126: 5, 110: 5, 129: 5, 111: 5, 151: 5, 159: 5, 121: 5, 125: 5, 119: 5, 205: 4, 139: 4, 150: 4, 155: 4, 103: 4, 223: 4, 141: 4, 98: 4, 154: 4, 123: 4, 131: 4, 157: 4, 149: 4, 301: 3, 186: 3, 145: 3, 158: 3, 229: 3, 138: 3, 232: 3, 122: 3, 201: 3, 137: 3, 112: 3, 204: 3, 134: 3, 196: 3, 164: 3, 190: 3, 146: 3, 153: 3, 117: 3, 192: 2, 327: 2, 329: 2, 194: 2, 127: 2, 328: 2, 167: 2, 171: 2, 282: 2, 257: 2, 191: 2, 174: 2, 228: 2, 176: 2, 325: 2, 788: 2, 380: 2, 169: 2, 120: 2, 178: 2, 156: 2, 230: 2, 173: 2, 152: 2, 208: 2, 233: 2, 177: 2, 188: 2, 197: 2, 222: 2, 220: 2, 162: 2, 143: 2, 193: 2, 179: 2, 242: 2, 140: 1, 421: 1, 1299: 1, 1006: 1, 1114: 1, 337: 1, 189: 1, 160: 1, 175: 1, 520: 1, 252: 1, 274: 1, 467: 1, 424: 1, 344: 1, 219: 1, 199: 1, 240: 1, 290: 1, 748: 1, 426: 1, 411: 1, 385: 1, 314: 1, 268: 1, 304: 1, 373: 1, 775: 1, 388: 1, 1155: 1, 273: 1, 185: 1, 651: 1, 406: 1, 494: 1, 132: 1, 333: 1, 383: 1, 217: 1, 225: 1, 438: 1, 701: 1, 1199: 1, 456: 1, 235: 1, 297: 1, 214: 1, 2414: 1, 1144: 1, 168: 1, 1032: 1, 135: 1, 211: 1, 1641: 1, 1775: 1, 248: 1, 315: 1, 295: 1, 475: 1, 308: 1, 130: 1, 807: 1, 213: 1, 251: 1, 187: 1, 244: 1, 427: 1, 184: 1, 181: 1, 265: 1, 347: 1, 247: 1, 264: 1, 165: 1, 180: 1, 183: 1, 224: 1, 340: 1, 341: 1, 198: 1, 147: 1, 331: 1, 182: 1, 212: 1})
x = []
y = []

for i in sorted(degin_distri):
    x.append(i)
    y.append(degin_distri[i] / len(H))

plt.figure(figsize=(10, 7))
plt.plot(x, y)

plt.xlabel("$k_{in}$", fontsize=18)
plt.ylabel("$P(k_{in})$", fontsize=18)

plt.xticks(fontsize=14)
plt.yticks(fontsize=14)

plt.yscale("log")
plt.xscale("log")
plt.axis([1, 10000, 0.00001, 1.0])
[1, 10000, 1e-05, 1.0]
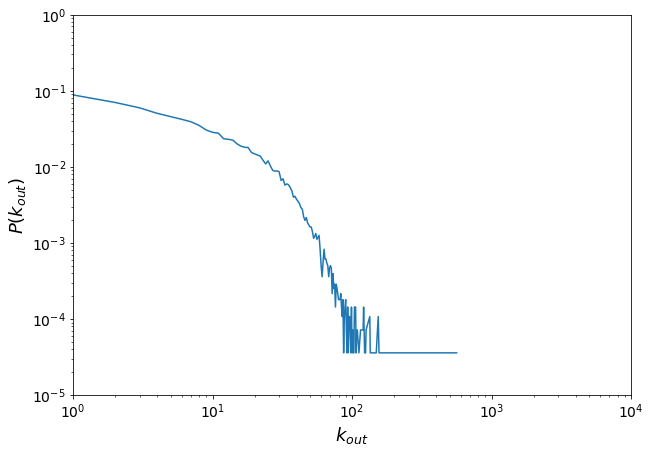
Let’s plot the degree out distribution
outdeg = dict(H.out_degree()).values()
degout_distri = Counter(outdeg)
x = []
y = []
for i in sorted(degout_distri):
    x.append(i)
    y.append(float(degout_distri[i]) / len(H))

plt.figure(figsize=(10, 7))
plt.plot(np.array(x), np.array(y))

plt.xlabel("$k_{out}$", fontsize=18)
plt.ylabel("$P(k_{out})$", fontsize=18)

plt.xticks(fontsize=14)
plt.yticks(fontsize=14)

plt.yscale("log")
plt.xscale("log")
plt.axis([1, 10000, 0.00001, 1.0])
[1, 10000, 1e-05, 1.0]
3.1.1.2. Export to gml (be careful this is a large network!)#
The file in gml format can be visualized using the software tool Gephi (http://gephi.org).
# nx.write_gml(H,'./../network_data/citHepTh.gml')
3.2. Visualizing a network with NetworkX#
NetworkX combined with matplotlib can be used to visualize complex networks.
It provides a good range of functionalities to obtain some basic and more refined visualization. More details are available in the documentation.
Notice, as stated in the documentation
NetworkX provides basic functionality for visualizing graphs, but its main goal is to enable graph analysis rather than perform graph visualization. In the future, graph visualization functionality may be removed from NetworkX or only available as an add-on package.
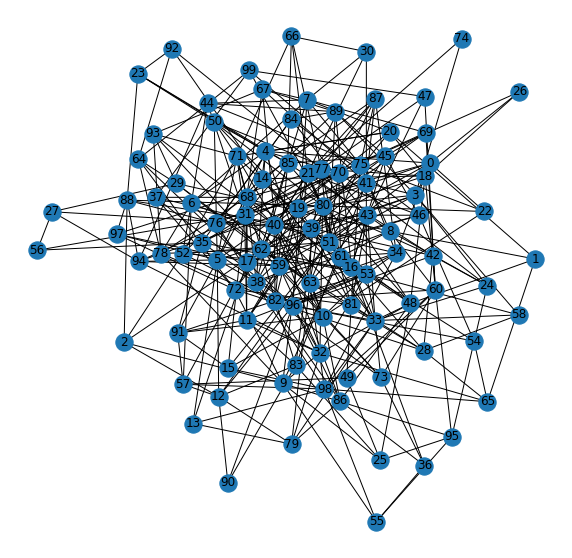
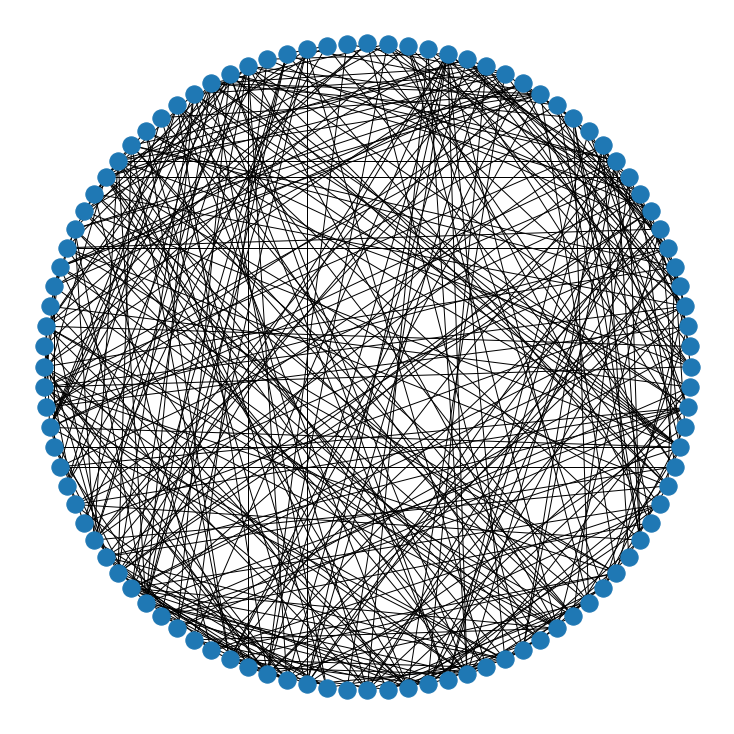
We generate a random Erdos-Rényi network and visualize it.
N = 100
prob = 0.08
ER = nx.erdos_renyi_graph(N, prob)
plt.figure(figsize=(10, 10))
nx.draw_networkx(ER)
plt.axis("off")
/Users/Michele/anaconda3/lib/python3.7/site-packages/networkx/drawing/nx_pylab.py:579: MatplotlibDeprecationWarning:
The iterable function was deprecated in Matplotlib 3.1 and will be removed in 3.3. Use np.iterable instead.
  if not cb.iterable(width):
(-0.9953043476435216,
 0.8720359272588877,
 -1.1050508369443799,
 0.8555790018206133)
plt.figure(figsize=(10, 10))
nx.draw_circular(ER)
/Users/Michele/anaconda3/lib/python3.7/site-packages/networkx/drawing/nx_pylab.py:579: MatplotlibDeprecationWarning:
The iterable function was deprecated in Matplotlib 3.1 and will be removed in 3.3. Use np.iterable instead.
  if not cb.iterable(width):
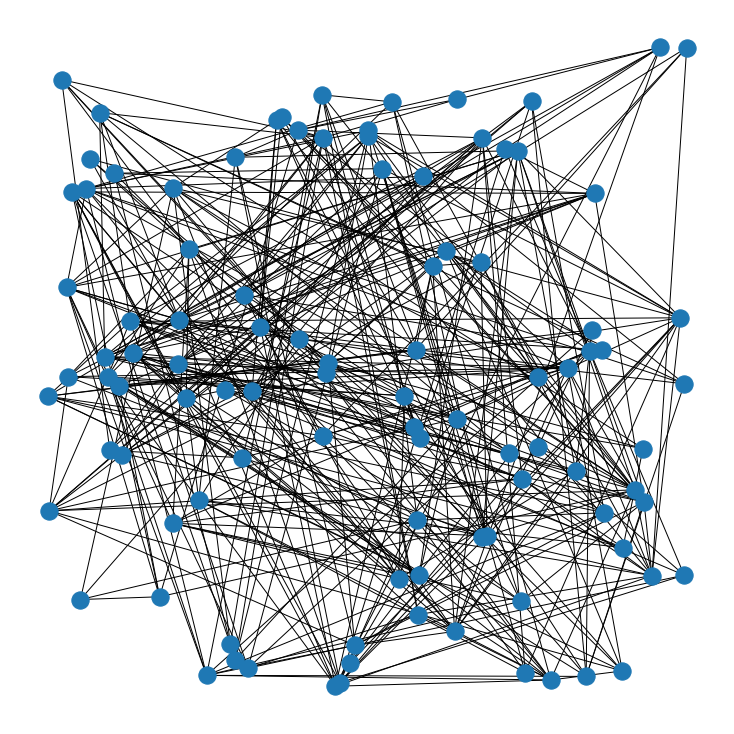
plt.figure(figsize=(10, 10))
nx.draw_random(ER)
/Users/Michele/anaconda3/lib/python3.7/site-packages/networkx/drawing/nx_pylab.py:579: MatplotlibDeprecationWarning:
The iterable function was deprecated in Matplotlib 3.1 and will be removed in 3.3. Use np.iterable instead.
  if not cb.iterable(width):
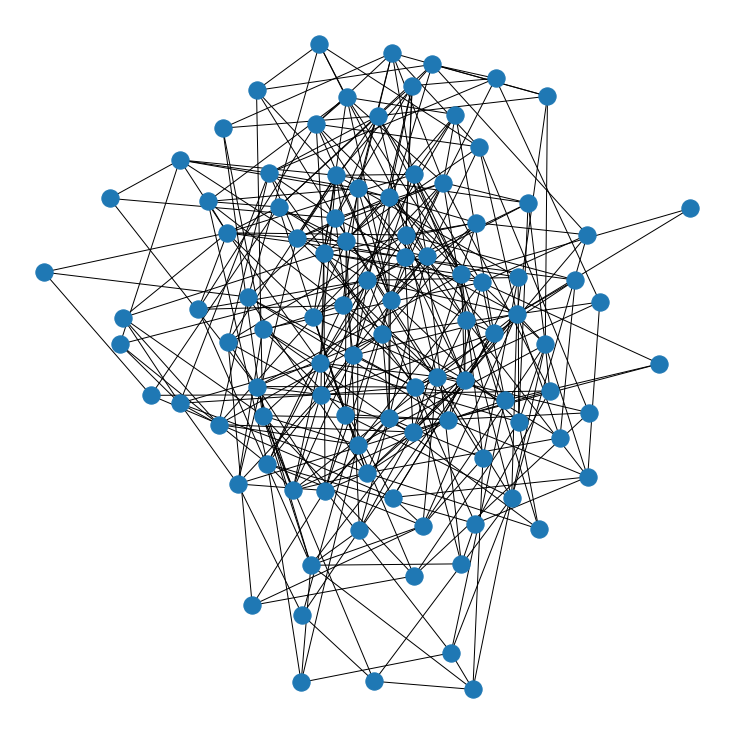
plt.figure(figsize=(10, 10))
nx.draw_spring(ER)
/Users/Michele/anaconda3/lib/python3.7/site-packages/networkx/drawing/nx_pylab.py:579: MatplotlibDeprecationWarning:
The iterable function was deprecated in Matplotlib 3.1 and will be removed in 3.3. Use np.iterable instead.
  if not cb.iterable(width):
pos = nx.spring_layout(ER)
pos
{0: array([-0.35586895,  0.37100536]),
 1: array([-0.73807419,  0.2442224 ]),
 2: array([ 0.18743948, -0.52354262]),
 3: array([ 0.12083755, -0.29566904]),
 4: array([-0.33053194,  0.15841373]),
 5: array([-0.07083   , -0.37833818]),
 6: array([ 0.08900052, -0.41197666]),
 7: array([ 0.1959074 , -0.15837123]),
 8: array([-0.06348377,  0.31605059]),
 9: array([-0.25595859,  0.08616082]),
 10: array([0.06598654, 0.56854944]),
 11: array([0.2181844 , 0.10990653]),
 12: array([ 0.52012317, -0.1687851 ]),
 13: array([-0.15588965, -0.76869646]),
 14: array([-0.00347682,  0.42857409]),
 15: array([-0.03848325,  0.54912745]),
 16: array([-0.42989889, -0.48084612]),
 17: array([-0.18842191, -0.84641495]),
 18: array([-0.16234101,  0.50984356]),
 19: array([-0.23884508, -0.29126009]),
 20: array([-0.32335897,  0.26331037]),
 21: array([ 0.22223539, -0.22685252]),
 22: array([-0.14098168,  0.84021266]),
 23: array([-0.5333254 ,  0.32383041]),
 24: array([-0.54389553,  0.12949113]),
 25: array([-0.15789808,  0.72978943]),
 26: array([-0.5565716 ,  0.77888981]),
 27: array([0.89509087, 0.03631352]),
 28: array([-0.220069  , -0.55081472]),
 29: array([0.64917535, 0.22901171]),
 30: array([ 0.76674386, -0.29578769]),
 31: array([0.21354925, 0.04054124]),
 32: array([-0.02493246, -0.17880648]),
 33: array([-0.11586854, -0.12652334]),
 34: array([0.13083429, 0.37875044]),
 35: array([0.38888481, 0.1660103 ]),
 36: array([-0.90355986, -0.06294386]),
 37: array([0.52830161, 0.19434504]),
 38: array([-0.45451672, -0.18497861]),
 39: array([-0.23522408, -0.14309463]),
 40: array([0.20654226, 0.23250939]),
 41: array([ 0.53824415, -0.09330346]),
 42: array([-0.44759436, -0.25953765]),
 43: array([-0.2964854 , -0.22689793]),
 44: array([ 0.5013085, -0.3126701]),
 45: array([-0.44790916, -0.58158983]),
 46: array([-0.29015384, -0.70457538]),
 47: array([-0.27988041,  0.67208906]),
 48: array([-0.1949367 ,  0.33041427]),
 49: array([0.08884443, 0.94758354]),
 50: array([-0.44612229, -0.07819714]),
 51: array([-0.05418373, -0.0681661 ]),
 52: array([-0.08444542, -0.24583725]),
 53: array([0.33621107, 0.04297796]),
 54: array([-0.18904208, -0.62199403]),
 55: array([-0.94241971,  0.26549767]),
 56: array([0.94372548, 0.3121947 ]),
 57: array([0.26090293, 0.29293587]),
 58: array([ 0.26871222, -0.64430145]),
 59: array([-0.00527864, -0.44159012]),
 60: array([-0.40434546,  0.53466287]),
 61: array([-0.0444586 ,  0.06348847]),
 62: array([ 0.26671355, -0.10819039]),
 63: array([0.0767051 , 0.06176777]),
 64: array([0.48124098, 0.46085826]),
 65: array([-0.66667796, -0.38387508]),
 66: array([0.55185664, 0.03465627]),
 67: array([ 0.49596939, -0.57698244]),
 68: array([ 0.04239096, -0.35692257]),
 69: array([-0.49110827, -0.02123321]),
 70: array([-0.17142626,  0.14318846]),
 71: array([ 0.12440289, -0.06567806]),
 72: array([ 0.09292502, -0.15055783]),
 73: array([-0.43641029,  0.03715602]),
 74: array([ 0.62120684, -0.78853617]),
 75: array([0.29982395, 0.47038797]),
 76: array([-0.66743167, -0.26771461]),
 77: array([0.18051146, 0.49172087]),
 78: array([ 0.35572638, -0.14065717]),
 79: array([ 0.20014641, -0.39919925]),
 80: array([-0.11730721,  0.12842549]),
 81: array([-0.3754887 , -0.41578983]),
 82: array([0.0924001 , 0.22372337]),
 83: array([0.572276  , 0.37873838]),
 84: array([-0.2900663 , -0.53960318]),
 85: array([-0.16210612, -0.04338881]),
 86: array([-0.24565476,  0.17881519]),
 87: array([0.40619517, 0.35316997]),
 88: array([-0.2408618 , -0.39609621]),
 89: array([ 0.04281368, -0.65829111]),
 90: array([1.        , 0.08474038]),
 91: array([0.35409105, 0.62897432]),
 92: array([0.00349014, 0.84932114]),
 93: array([ 0.69079113, -0.13529681]),
 94: array([ 0.39423643, -0.4073228 ]),
 95: array([-0.72382344,  0.57174106]),
 96: array([ 0.27240526, -0.02676023]),
 97: array([ 0.08693096, -0.78586749]),
 98: array([-0.36422309,  0.05425584]),
 99: array([0.28011261, 0.74198145])}
We can draw the network nodes only, and assign a specific location to each node.
plt.figure(figsize=(8, 6))
nx.draw_networkx_nodes(ER, pos)
plt.axis("off")
(-1.0608809320752874,
 1.118461217455089,
 -0.9653222576452914,
 1.0664908495799543)
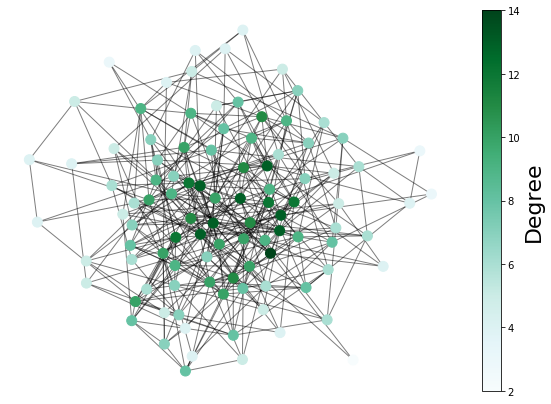
plt.figure(figsize=(10, 7))

s = nx.draw_networkx_nodes(
    ER,
    pos,
    node_size=100.0,
    node_color=list(dict(nx.degree(ER)).values()),
    alpha=1,
    cmap=plt.cm.BuGn,
)

nx.draw_networkx_edges(ER, pos, alpha=0.5)

# show the colorbar on the right side
cbar = plt.colorbar(s)
cbar.ax.set_ylabel("Degree", size=22)

plt.axis("off")
plt.show()
/Users/Michele/anaconda3/lib/python3.7/site-packages/networkx/drawing/nx_pylab.py:579: MatplotlibDeprecationWarning:
The iterable function was deprecated in Matplotlib 3.1 and will be removed in 3.3. Use np.iterable instead.
  if not cb.iterable(width):
3.3. Visualizing a spatial network with NetworkX#
We analyze the US airport network of year 2010. The network is available from the network repository of Tore Opshal.
Weights represent the total number of passengers who traveled on that connection in a year.
Airport coordinates have been added by myself.
airport_path = "./../datasets/USairport_2010.txt"
meta_path = "./../datasets/USairport_2010_codes.txt"
G = nx.Graph()
fh = open(airport_path, "r")
for line in fh.readlines():
    s = line.strip().split()
    G.add_edge(int(s[0]), int(s[1]))
fh.close()
len(G)
405
Is the network fully connected?
nx.number_connected_components(G)
2
The first connected component in the list is always the largest
c = list(nx.connected_components(G))
c[1]
{1182, 1347}
We define three dictionaries associated to the network to store additional node’s features: IATA code, aiport name, geographic coordinates.
G.code = {}
G.name = {}
G.pos = {}
We extract nodes features from a file
finfo = open(meta_path, "r")
for line in finfo.readlines():
    s = line.strip().split()
    node = int(s[0])
    G.code[node] = s[1]
    G.name[node] = s[2]
    G.pos[node] = (float(s[4]), float(s[3]))
finfo.close()
Draw the network
fig = plt.figure(figsize=(15, 8))

nx.draw_networkx_nodes(G, pos=G.pos, node_size=20)

# nx.draw_networkx_edges(G,pos=G.pos)

nx.draw_networkx_labels(G, pos=G.pos, labels=G.code)

plt.axis("off")
(-127.0525636795403, -65.23493632045967, 23.337955614957576, 50.01204438504242)
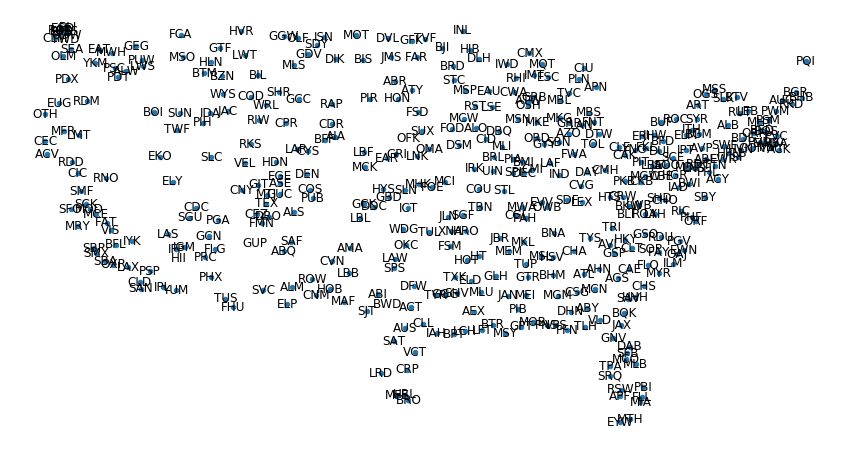
We would like to draw the edges but there are too many of them.
len(G.edges())
8251
We select only the strongest connections as a subgraph of G by setting a threshold on the annual passengers volume.
weight_threshold = 300000
H = nx.Graph()

H.pos = {}
H.code = {}
H.name = {}

fh = open(airport_path, "r")
for line in fh.readlines():
    s = line.strip().split()
    node1 = int(s[0])
    node2 = int(s[1])

    weight = int(s[2])

    if weight > weight_threshold:
        H.add_edge(node1, node2)

        H.pos[node1] = G.pos[node1]
        H.pos[node2] = G.pos[node2]

        H.code[node1] = G.code[node1]
        H.code[node2] = G.code[node2]

        H.name[node1] = G.name[node1]
        H.name[node2] = G.name[node2]

fh.close()
len(H.edges())
205
We draw the network and color code the nodes by their degree.
fig = plt.figure(figsize=(15, 8))

s = nx.draw_networkx_nodes(
    G,
    pos=G.pos,
    node_color=[math.log(G.degree(v), 10) for v in G],
    node_size=30,
    cmap=plt.cm.YlOrRd,
)

nx.draw_networkx_edges(H, pos=G.pos, alpha=0.5)

nx.draw_networkx_labels(
    H,
    pos=H.pos,
    labels=H.code,
)

cbar = plt.colorbar(s)
cbar.ax.set_ylabel("$log(k)$", size=22)

plt.axis("off")
/Users/Michele/anaconda3/lib/python3.7/site-packages/networkx/drawing/nx_pylab.py:579: MatplotlibDeprecationWarning:
The iterable function was deprecated in Matplotlib 3.1 and will be removed in 3.3. Use np.iterable instead.
  if not cb.iterable(width):
(-127.05322413269565, -65.2342758673043, 23.336684461326623, 50.01331553867337)
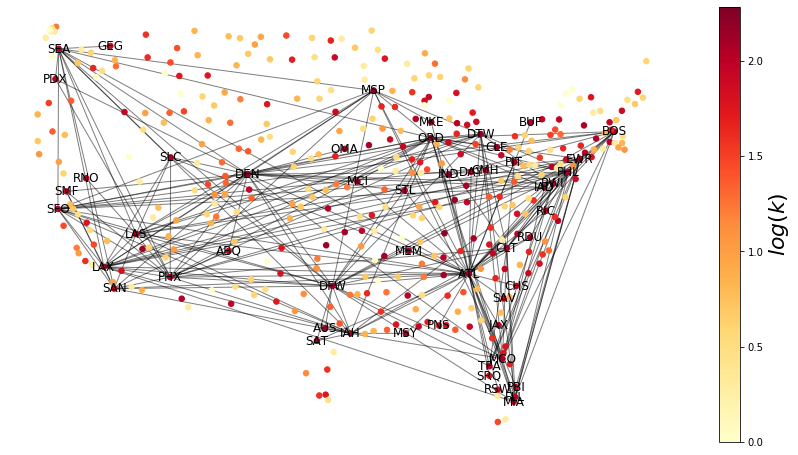
What is the node with the largest degree?
max(dict(G.degree()).items(), key=itemgetter(1))
(389, 192)
G.name[389]
'Denver'
3.4. Data visualization with NetworkX#
The easy interface of NetworkX and matplotlib to draw georeferenced data can be used to visualize all type of data points with geo-coordinates.
A nice example comes from the electoral results of the municipality of Turin available at the Open Data repository AperTO.
Electoral data can be geo-referenced through the dataset containing every street number of the city with its coordinates.
Based on this idea, we created a Web-interface to explore electoral data of the city of Torino: Il colore di Torino

